February 6, 2011
Cadillac Mining Updated Chart: Retracement Appears To Have Hit Bottom
John: Friday, Cadillac Mining (CQX, TSX-V) opened at its low of 24 cents and closed at its high of 25 cents on low CDNX volume of only 92,000 shares. It was up 1 penny for the day and down 3.5 cents for the week.
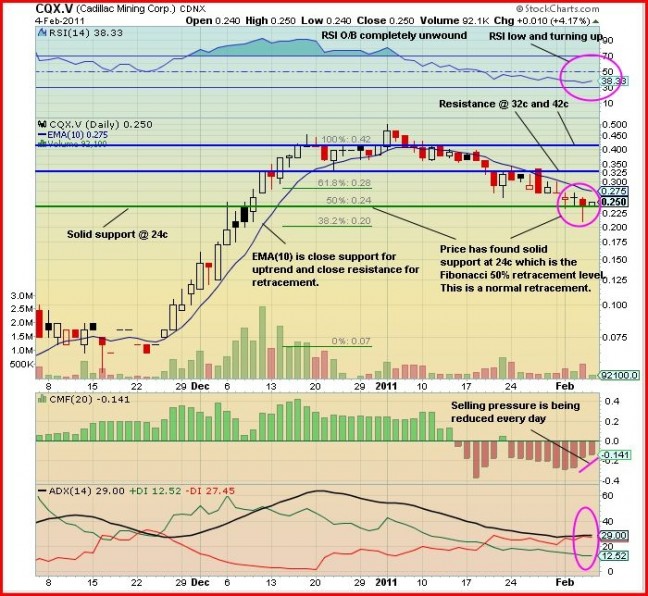
Looking at the 3-month daily chart, we see how on November 25 CQX started a very orderly advance from a base of 7 cents to a high of 50 cents on January 4. The move up on Jan. 4 from the resistance level of 42 cents to 50 cents was a false breakout or bull fake. Since then the stock has retraced down to find support at 24 cents.
The last 5 trading sessions are of particular importance. The candles for Monday, Tuesday and Wednesday are all dojis – indecision, typical of trading action at the end of a retracement. Then on Thursday, another bottom sign, the candle is a hammer with the close right on the support at 24 cents. Friday’s trading, although light, was bullish, with a small white candle. Another important point is that 24 cents coincides with the Fibonacci 50% retracement level which also provides support. Indeed, this very much looks like a bottom.
The EMA(10) moving average provides close support for uptrend trading and is resistance for retracement or downtrend moves. The bullish sign we look for in a reversal is a close above the EMA(10) with much higher volume and a white candle the following day on high volume for confirmation of the reversal. There are two resistance levels shown (blue horizontal lines) at 32 cents and 42 cents.
Looking at the indicators:
The RSI overbought condition in December has been completely unwound. The RSI declined all of January but has now turned up and is at 38% – bullish.
The Chaikin Money Flow (CMF) indicator shows how the stock has been under selling pressure for most of January but this has started to ease during the last 3 trading sessions. The CMF is at – 0.141.
The ADX trend indicator has the -DI (red line) at 27 and above the +DI (green line). Both are flat. The ADX trend strength (black line) indicator is also flat at 29. This is a typical orientation at the end of a retracement.
Outlook: There is a strong case for CQX to be at the bottom of a retracement, so good news should move the stock to the upside rather quickly.
Note: The writer holds a position in Cadillac Mining.

Inga kommentarer:
Skicka en kommentar